|
|
Energy and PV System Monitoring |
|
12/08/09 |
|
|
Energy and PV system monitoring Local Power is very interested in energy and PV system monitoring solutions. We believe that having good realtime information, rather than just quarterly bills, is crucial to changing our behaviour in using energy as well as ensuring our PV systems are working well. The Queensland State Government is currently offering a wireless energy monitor (Centameter OWL) as part of their ClimateSmart Home service which includes an energy audit, up to 15 CFL light bulbs, a low flow shower head etc. and costs $50. This monitor can tell you how much energy your whole house is using. Click here to find out more. In addition if you are in the Brisbane City Council area, the council will rebate this back to you. Click here to find out more about this rebate. We recommend this excellent initiative to everyone! Below is some information we have collected about monitoring solutions which can monitor the energy of your whole home and/or PV system. These are different from portable power meters (see also below) that can measure the electricity used on an individual appliance or power point, although these can be very useful also to do your own energy audit. You can click on the name of the solution and get more information and in some cases purchase from other websites. We welcome feedback on the information below.
Monitoring Solutions - Pros and Cons There are some "pros and cons" between the two main types of energy monitoring currently available, i.e.
Monitoring of PV systems with the Feed-in Tariff For PV system owners the Solar Bonus Scheme (FiT Feed-in Tariff) often confuses the clip on wireless sensors during daylight hours because the FiT in Queensland is of the import-export (nett) style of metering. In this model of FiT energy flows are both directions to and from your meter. The clip on wireless sensors can only detect the amount of power which is flowing but not it's direction, so if you are importing 300W (using more than you are generating at the time) or exporting 300W (generating more than you are using at the time) the display will read 300W and at no time in daylight hours will you easily know your energy usage. The ClimateSmart Home information booklet in explaining this says "Depending on how your PV system is wired to your electricity box, your monitor may not always give you an accurate reading during daylight hours. However, during the evening your monitor should give you a better indication of the energy your appliances are consuming - helping you to control your energy consumption" It is possible for an electrician to counteract this problem
according to an experienced PV engineer by "All they have to do is
clamp the sensor around _both_ the fat consumer main active from the
grid _and_ the skinny active wire from the inverter. That way any
current going from inverter to grid passes through the sensor twice in
opposite directions and the magnetic fields cancel out."
Changing wiring in a meterbox should never be attempted by anyone except
licensed electricians! In the same week that the giants of the internet and
computer industries announced the
google power meter initiative and IBM is building the first national
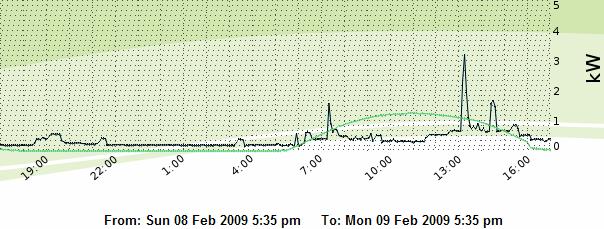
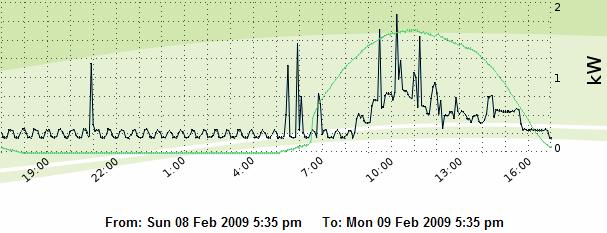
smart grid, Local Power is pleased to provide live PV and energy use
monitoring graphs below in partnership with a local
Queensland company. Click on the graphs below to see live generation data sample building with 2kW system (upgraded from 1.5kW system)
sample building with 3kW system (upgraded from 2kW system)
sample building with 3kW system
Portable power meters Local Power is currently trialing the "Watts up? .Net" meter and will provide links to some interesting graphs shortly.
|
|||||||||||||||||||||||||||||||||||||||||||||||||||||||||||||||||||||||||||||||||||||||||||||||||||||||||||||
This site was last updated 12/08/09